

Digital analysis of the correlation between children’s academic progress and extracurricular activities programs

Practice description
Tasks:
Improving school and extra-curricular education quality by setting up a rating of educational institutions
The service helps determine how extracurricular education, interest clubs and sports sections influence a child’s academic success.
Problems to solve:
- Lack of system to determine a child’s development trajectory.
- The data depersonalization procedure takes too long, data collection requires interactions with a number of systems.
Target audience:
- education bodies of the Russian constituent subjects
- education institutions
- children and their parents
Solution capabilities:
- Analytical data linking a child’s current academic progress and extra-curricular education they receive, USE score and choice of subjects to test
- Getting information on opportunities provided by extra-curricular education and on the impact a given college has on academic success, final score, choice of subjects, and the connection between that choice and the future career; adjusting the extra-curricular information system.
- Improving the students’ academic progress
- Saving budget funds by using open source free software.
Solution usability:
The software architecture allows using it in information systems of any region without any significant changes to the latter.
Charts are displayed on the dashboard using AmCharts, a free JavaScript Framework.
The solution has a software interface for data reception and processing results transfer, and can be copied for use in other areas or organizations, or handed over to other Russian regions.
Data sources:
- Data provided by the regional Ministry of education and science
- Data provided by general and extra-curricular education institutions in the region
The dashboard has three tabs:
1. Source data.
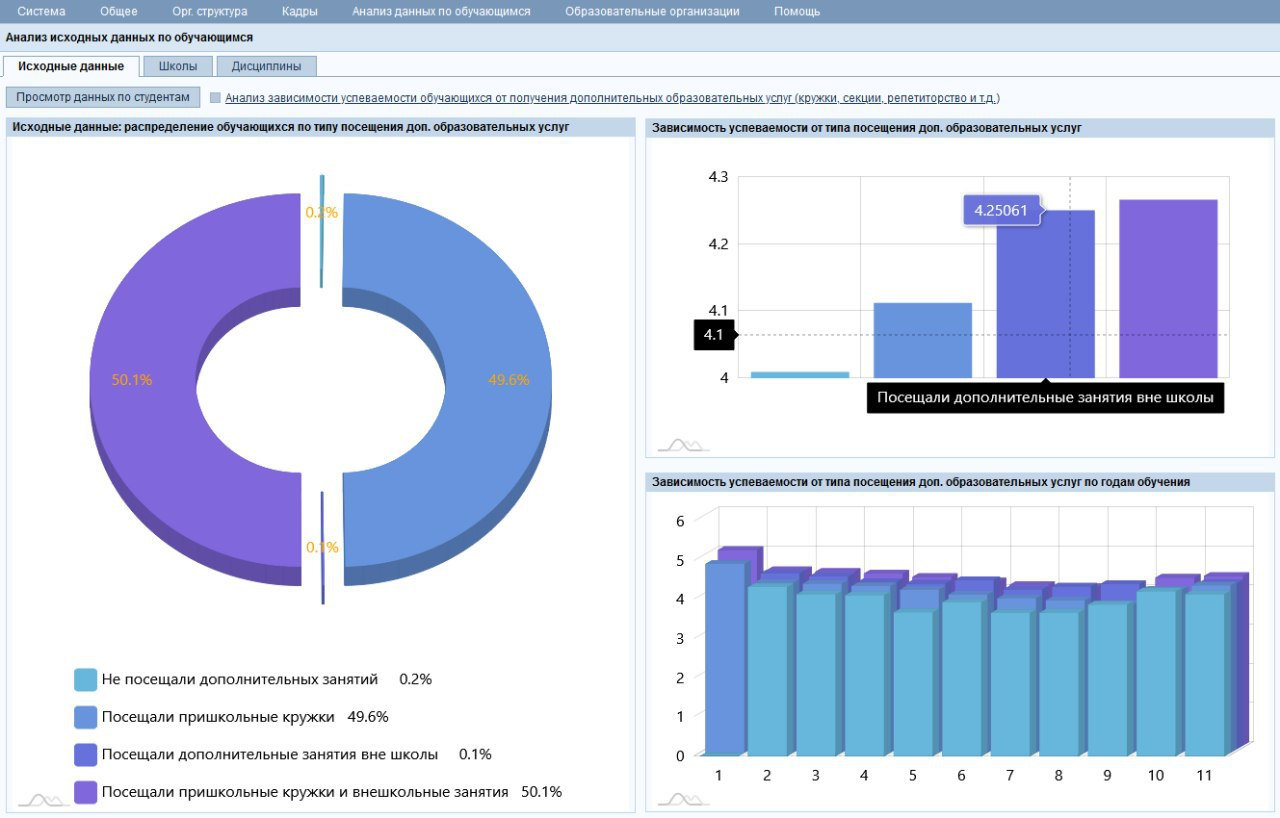
1.1. sort students by type od extra-curricular education services attended
There a user can see the shares of students not using any extra-curricular services, those who attend school clubs, and those who use extra-curricular services outside of school. A pie chart with clickable sectors that can be expanded. You can open a sector by clicking a corresponding color rectangle in the legend.
1.2. Relationship between academic progress and the type of extra-curricular. services attended.
Average academic score is displayed for each type of extra-curricular clubs, sections, private lessons, etc. attended/not attended. If you hover your cursor over a specific column, you will get screen tips specifying the extra-curricular services’ values and attendance types.
1.3. Relationship between academic progress and the type of extra-curricular service attendance broken down by years of study.
A similar chart for each year of studies, values per category are displayed as column stacks. If you hover your cursor over a specific column or a stack layer, you will get screen tips with information on the year of study, type of extra-curricular services attendance, and the average academic score.
1.4. Report download to Excel.
1.5. An option to view the source data list (students’ scores), see the «View data by student» button.
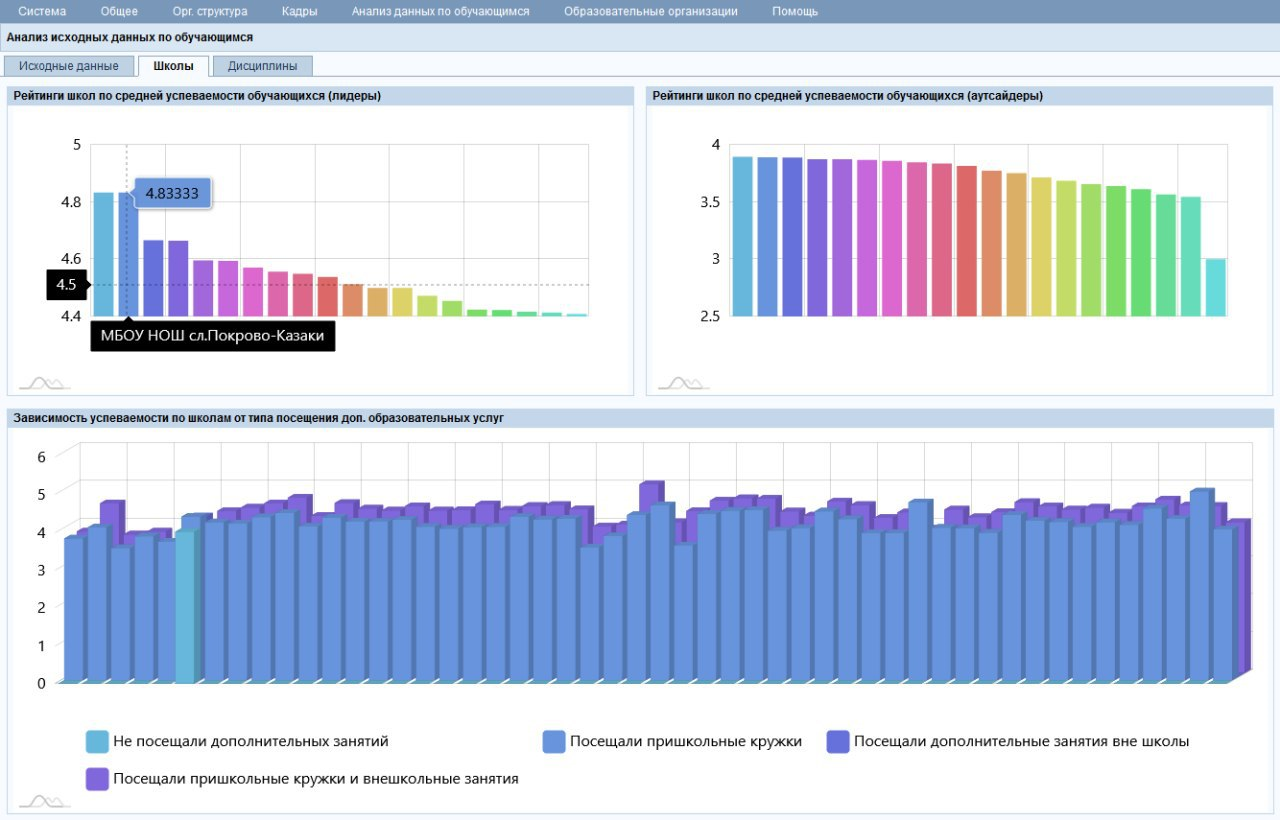
2. Schools Data breakdowns by school.
2.1. School ratings by average academic score (leaders).
Information on average academic score for 20 schools with the highest values is available. If you hover your cursor over a column, you will get a screen tip with the school name and the average academic score.
2.2. School ratings by average academic score (outsiders).
Information on average academic score for 20 schools with the lowest values is available. The chart behaves similar to the previous one.
2.3. Relationship between academic scores (by school) and the type of extra-curricular services attendance.
The chart shows the relationship between academic scores for fifty random schools broken down by type of extra-curricular services attendance.
If you hover your cursor over a specific column stack layer, you will get a screen tip with the school name, the type of extra-curricular services attendance, and the average academic score of the students. To make navigation between stack layers more convenient, you can turn some layers off by clicking the corresponding color rectangle in the chart legend. As an example, the data for Lipetsk shows that students of almost all schools attend school interest clubs at least, or some extra-curricular services outside of school. There’s almost no students who don’t use any extra-curricular services.
3. Academic subjects.
3.1. The relationship between the subject score and the type of extra-curricular services attendance.
The chart shows a sample of average subject scores with breakdown by type of extra-curricular services attendance. Only the subjects for which there’s at least one full set of scores by type of extra-curricular services attendance, are included in the sample. The chart is displayed as a set of columns with stacked layers. If you hover your cursor over a stack layer, you will get a screen tip showing the subject name, the extra-curricular services attendance type, and the average score of the students that have been scored for that academic subject. You can turn some stack layers off by clicking the corresponding color rectangle in the chart legend.
Implemented dashboard app:
- Perm Territory
The service is a set of subsystems:
- the integration subsystem — is a component responsible for external data download, processing and upload processes
- the storage subsystem — is a means of consolidated storage of data array collected from various sources
- the analysis/calculation subsystem is meant to run information processing (incl. regression analysis)
- the reports generation and visualization subsystem is a component focused on running analytics and generating reports based on the interactive analytical data processing toolset.
Practice website
Practice result
- in the Lipetsk region, 49,6% attended school clubs, 0,2% did not attend additional classes, 50,1% attended extracurricular classes.
- in the Perm Region the attendance is one hundred percent (unloading was done from the system of attendance of additional services)
Implementation cost: Up to 500 thousand ₽
Implementation stages
3 month
Подготовительный этап